A Consistent Edge For Bilingual Education
by James Crawford
In 1998-1999, for the third year in a row, students learning English in bilingual education programs scored significantly higher in [English] reading and language than students enrolled in English Only programs, according to the Arizona Department of Education (ADE). The comparison of Stanford 9 achievement test results is found in the ADE’s latest report on the education of English learners in Arizona.
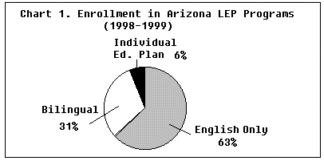
Clearly, schools that offer bilingual instruction are doing something right. They should be congratulated and the ADE should help other schools to follow their example. Only 31 percent – less than a third – of the state’s limited-English-proficient (LEP) students were enrolled in bilingual education last year (see Chart 1).

In releasing the report, Superintendent of Public Instruction Lisa Graham Keegan unfortunately chose to accentuate the negative. She complained that LEP students overall “score 20 percentage points below native speakers of English.” This is an accurate statement, but it should come as no surprise to anyone familiar with the challenges facing LEP children. The Stanford 9 tests are given entirely in English – a language these students are still learning – and their performance is graded in relation to that of native English speakers. As they acquire more English and their achievement approaches the “norm,” LEP students are reclassified as English-proficient and “mainstreamed” into regular classrooms. With their higher scores, they are no longer counted as limited in English. So the LEP group – by definition – will remain below the norm. But that does not mean that LEP students are failing to progress.
To the contrary, the Stanford 9 scores show that students in three different types of bilingual education appear to be doing well – especially when compared with their peers receiving only English instruction. These program models, as authorized by state law, include:
- transitional bilingual education in grades K-6, an approach that teaches academic subjects partly in the native language while students are making the "transition" to English;
- secondary bilingual education, a transitional program for grades 7-12;
- bilingual-bicultural education, a model that develops students’ native-language skills as well as English, emphasizing fluent bilingualism as well as academic achievement; and
- English as a second language, an approach to teaching English through "immersion" and direct instruction, with little or no use of the native language.
It is important to note that, in reporting the Stanford 9 results, the ADE did not conduct a scientifically rigorous study that "controlled" for extraneous variables. That is, there was no way to tell whether children in bilingual and English Only programs were fully comparable – for example, in prior knowledge of English, parental education levels, and socioeconomic status – or whether they differed in ways that affected their scores.
Nevertheless, the superiority of bilingual programs was remarkably consistent. In reading, for example, English learners in various forms of bilingual education scored at higher levels than their English Only counterparts at every grade level, for the third consecutive year– as long as the ADE has been reporting these scores.
It is also significant that the edge for bilingual programs grows in the upper grades – confirming other studies showing that the benefits of native-language instruction increase over a student’s school career.
in Arizona Programs, School Year 1998-99 (Percentiles and Normal Curve Equivalents)* |
|||||||
| GRADE | |||||||
| *Average scores are weighted to take account of the number of students tested. | |||||||
| **Comparison of bilingual vs. English Only programs based on NCEs. | |||||||
| Source: Arizona Department of Education, English Acquisition Services: A Summary of Bilingual Education Programs and English as a Second Language Programs for School Year 1998-99 (January 2000) | |||||||